- 06 Mar 2024
- 1 Minute to read
- Print
- DarkLight
Integration Dashboard Access and Navigation
- Updated on 06 Mar 2024
- 1 Minute to read
- Print
- DarkLight
Abstract
Product: Integration Dashboard
Access
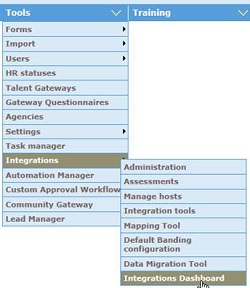
To access the Integrations Dashboard, in Workbench, select Tools → Integrations → Integrations Dashboard. Every dashboard session times out by default after 20 minutes of inactivity.
All times that are displayed on the Integration Dashboard are based on the Data Center where the client is hosted. The US data center is in EST. The EU data center is in GMT.

Navigation
The integration dashboard is made up of health panes and Integration Portfolios. Users can access detailed information about each report type. The health report includes information on when an integration ran and identifies failures. The portfolio section breaks out the various types of integrations and is used to access overall and detailed integrations within the category. The integration dashboard is available for BrassRing interfaces only and does not reflect Talent Suite, Talent Insights, or Onboard integrations. The integration dashboard works for both Production and Staging environments.
The Dashboard is a responsive interface and adjusts to the size of the screen of the device used by the user. Wherever there is a grid that is used to provide data, pagination is provided to ensure smooth user experience and control over the number rows that is displayed. A keyword search can be performed on most screens.
Select Back to return to the previous page visited.
Select Search to search the integrations dashboard.
Select Home to return to the integrations dashboard home page.

Select Copy to copy the information on the displayed grid.
Select CSV, MS Excel, or PDF to export the displayed grid to the selected file type.
Select Print to print the information on the displayed grid.
Donut charts display after the Profile Tiles. Based on the integration logs, the health of the integrations displays in a set of donut charts. The donut chart indicates the success or failures for the standard integrations and there are three donut charts displayed depicting:
The health of integrations that were run today. This indicates the overall count of success or failures for today for standard integrations.
The health of integrations that were run in the last seven days. This indicates the overall count of success or failures for the last 7 days count for standard integrations.
The integrations run the maximum number of days are displayed. This indicates the success or failure count as per availability in the database.

