Access and Navigation
Abstract
Product: Integration Dashboard
Access
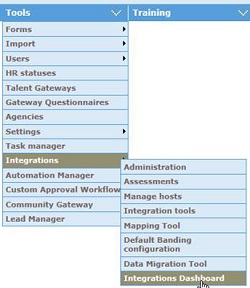
To access the Integrations Dashboard, in Workbench, select Tools → Integrations → Integrations Dashboard. Every dashboard session times out by default after 20 minutes of inactivity.
All times that are displayed on the Integration Dashboard are based on the Data Center where the client is hosted. The US data center is in EST. The EU data center is in GMT.

Navigation
The integration dashboard is made up of health panes and Integration Portfolios (please see Integration Portfolios in this page for more information). Users can access detailed information about each report type. The health report includes information on when an integration ran and identifies failures. The portfolio section breaks out the various types of integrations and is used to access overall and detailed integrations within the category. The integration dashboard is available for BrassRing interfaces only and does not reflect Talent Suite, Talent Insights, or Onboard integrations. The integration dashboard works for both Production and Staging environments.
The Dashboard is a responsive interface and adjusts to the size of the screen of the device used by the user. Wherever there is a grid that is used to provide data, pagination is provided to ensure smooth user experience and control over the number rows that is displayed. A keyword search can be performed on most screens.
Select Back to return to the previous page visited.
Select Search to search the integrations dashboard.
Select Home to return to the integrations dashboard home page.

Select Copy to copy the information on the displayed grid.
Select CSV, MS Excel, or PDF to export the displayed grid to the selected file type.
Select Print to print the information on the displayed grid.
Donut charts display after the Profile Tiles. Based on the integration logs, the health of the integrations displays in a set of donut charts. The donut chart indicates the success or failures for the standard integrations and there are three donut charts displayed depicting:
The health of integrations that were run today. This indicates the overall count of success or failures for today for standard integrations.
The health of integrations that were run in the last seven days. This indicates the overall count of success or failures for the last 7 days count for standard integrations.
The integrations run the maximum number of days are displayed. This indicates the success or failure count as per availability in the database.

Portfolios
Abstract
Product: Integration Dashboard
Portfolios

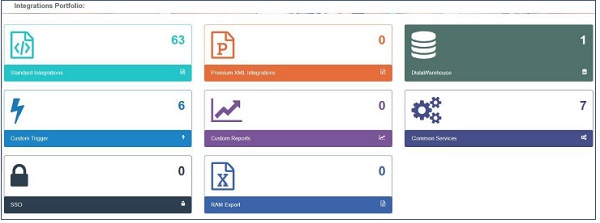
The portfolios screen displays the various integrations types and other services that clients configured in their Talent Acquisition setup. The following portfolios are displayed:
Standard Integrations
Premium XML Integrations
Data Warehouse
Custom Triggers
Custom Reports
Common Services
SSO (Single Sign-On)
RAM Exports
Infinite Talent Onboarding Integrations
Double click a portfolio to open it. A detailed report of that portfolio opens. Select another portfolio by using the pull-down menu to open it. Each portfolio has two tabs. The Active tab displays all the active, running, and scheduled integrations information. The inactive tab displays all those integrations that are currently inactive.
Useful Tips
Select All Integrations to view a summary snapshot of all integrations.

Select the i information icon to view corresponding information.
Select the count in the Integrations graph to display logs of successful or failed integrations within that specific hour. 0 is the current hour on the x-axis and 24 is current hour minus 24. This graph shows count of success and failure of all the integration logs.
Search for an integration record with the Message ID, a date range, success or failure status.

Select the message id hyperlink to view the ability to view request and response details and to cross-check for accuracy.
Standard Integrations
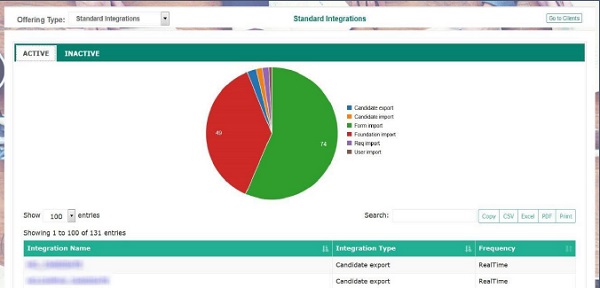
This portfolio displays the list of all integrations that were configured by using the Mapping Tool by BrassRing Workbench users. The pie chart displays a distribution of all the types of standard integrations presently active for this client. A grid with a list of all the integrations is displayed. This grid provides information about the type of integration and the frequency at which each integration runs. Select the name of the integration to open a graph with the success-failure information displays and a grid that shows the status of various instances of the integrations for the last seven days.

Premium XML Integrations
This portfolio displays a grid with a list of all the premium XML-based integrations that are created specifically for the client. It also displays the status, frequency at which these integrations run, and the last run date of each of the integrations. Select the name of the integration to open a graph of the success-failure status based on the number of attempts displays. A grid with the status and information of the integrations that were run in the last seven days are displayed here.
Data Warehouse
For clients that have engaged Infinite Technical Solutions Expert (SE) team in posting the client’s bulk BrassRing data to FTPs, is listed under the Data Warehouse integration portfolio. The names of the Data Warehouse integrations are hyperlinks. Select the name of the integration to open a graph of the success-failure status based on the number of attempts. A grid with the status and information of the integrations that were run in the last seven days are displayed in the data warehouse pane.
Custom Triggers
Custom Triggers are customized action-based triggers that are scheduled to perform a designated set of tasks. A list of all such integrations is displayed under Custom Triggers Portfolio. This grid displays a list of all integration names, integrations types, the frequency at which each of the integrations run, their last run date and time, and the status of whether the integration is success or a failure. Custom triggers are built by the Infinite Technical Solutions Expert team, showing RAM exports that are configured by them where they export data to external systems. Triggers include:
Custom triggers built by the Infinite Technical Solutions Expert to fire off integrations.
Self-Service RAMs built by the Infinite Technical Solutions Expert or Client.
Automation Manager triggers, by using the standard triggers available under the Automation Manager configuration.
Custom Reports
Custom Reports are all those reports that were created based on client request and are not produced by the Data Insight Tool. These reports are provided by the Infinite Technical Solutions Expert team based on the requirements that are provided by the client. Selecting the count in the reports pod, displays the list of reports available with a time log.
Common Services
Common Services Integrations are client integrations with BrassRing vendors by using the common services integrations that do not require Infinite Technical Solutions Engineering effort. The grid provides all the information about the common services integrations this client has purchased or implemented with the various BrassRing vendors.
SSO
The Single-Sign-On (SSO) grid lists SAML 2.0 Single Sign On instances in place for users logging into BrassRing and BrassRing Talent Gateways. Select the count in the SSO pod to view all SSO activity. The SSO tile does include SSO into the Infinite BrassRing Platform or any BrassRing or BrassRing Talent Gateways that are housed in the platform.
RAM Export
This grid lists all the RAM Export integrations that are configured by the client and includes:
Identity names of all the integrations.
The type of integrations.
The frequency at which each integration is run.
The status.
The last run date and time.
Infinite Talent Onboarding
View integrations between Infinite Talent Onboard and external systems in the Integrations Dashboard. This gives you the visibility into your Onboard integrations that you previously didn’t have, and can be used to help troubleshoot issues or view activity.