Abstract
Product: The Metrics Dashboard
The Metrics Dashboard
This page describes the processes for using the Metrics Dashboard.
Edits to visualizations are persistent in the Metrics Dashboard. There is no save option and edits to visualizations are automatically updated and remain edited on the next log in.
For more information about the Metrics Dashboard, see the Metrics Dashboard Example Visualizations.
For more information about configuring visualizations in the Visualization Library for Persona Groups, see Example Visualizations.
Build 20.06.01. All types of custom req multi-select fields, including check boxes and multi-select drop downs, are available in the Metrics Dashboard. The fields must be Searchable to be available. The fields cannot be made outputable in Workbench, but do appear in the Metrics Dashboard.
Relevant eLearning
Process
Create or Add a Visualization
A notification stating This visualization has been updated by another user displays if a user attempts to save a visualization that has been saved by another user concurrently.
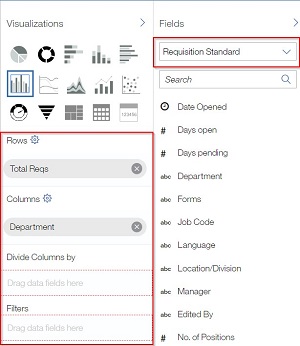
Select Add Visualization. The Visualizations and field titles appear.

Select the chart type. Chart types can be changed after the output is defined. For more information on chart types, see The Metrics Dashboard Example Visualizations.
The Fields pane categorizes fields that can be added to the chart. For example: Candidate, Candidate form, or Reqs. Select the field and drag it to the appropriate labels of the chart, such as rows, columns, or filters.

The visualization refreshes with the new fields.
Duplicate or Copy a Visualization
Copying a subscribed visualization unlinks the copy from the subscribed visualization.
On the visualization to be duplicated or copied, select Actions → Copy.
A new visualization is added to the dashboard with Copy appended to the title. Edit the copied visualization as needed.
Edit Visualizations, Fields, Filters, or Visualization Rows, Columns, or Slices.
Updates to visualizations can be previewed before saving by selecting Preview.
If the chart type is changed, all rows and columns are cleared. It is recommended to copy a visualization and change the chart type on the copy to maintain the original data.
The Field category Aggregate provides sums that can be selected as follows: # New Candidates, # Total Submission, # Total Candidates, # Total Reqs.
Aggregate # New Candidates displays the aggregate count of new candidates and considers any unviewed candidates for the user who is logged in to the Metrics Dashboard. If the visualization that is being built is associated to candidates within a req folder, and has req context, then the client setting New/Viewed tied to Req is considered. If the visualization is not req specific, then the aggregate number is based on the overall viewed flag as seen when running a candidate search within BrassRing.
Aggregate # Total Candidates, Submissions, Reqs, Leads, and Campaigns displays the aggregate counts for these fields, considers the user’s user type privileges, and calculates candidates, reqs, leads and campaigns that they have access to view within BrassRing or Lead Manager.
For Administrators: editing a visualization in the Visualization Library automatically cascades the changes to its persona workspace counterparts.
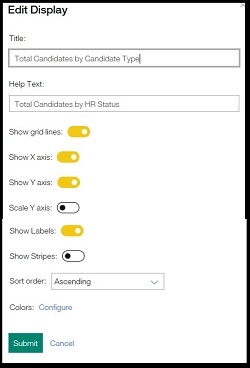
To edit the display of a visualization, select Actions → Edit Display.
Update the Title, Help Text, appearance of the visualization, and visualization colors as needed. The options that are displayed vary based on the type of visualization that is being edited. If your organization has enabled additional BrassRing UI locales, the + icon displays for the Title and Help Text fields to allow for translations to be entered.

To edit a chart type, in the visualization, select Actions → Edit Fields, or select the visualization and expand the Visualization and Field panes. Select the new Chart Type in the visualization pane.
If the new chart type is incompatible with the existing chart type, a notification message appears stating that the Chart that you are about to switch to has some incompatible fields. Select OK to continue changing the chart type or Cancel to cancel the change.
To edit a Visualization’s rows, columns or slices, select the gear icon.
Select the edit pencil icon to update the rows, columns, or slices as needed.
Select Save.
To edit the fields of a visualization, select Actions → Edit Fields, or select the visualization and expand the Visualization and Field panes.
To add a field, select a category on the Fields pane and select the new field. Drag the field to the visualizations label. The field is added to the visualization.
Select the X icon on the visualization page to remove an existing field.
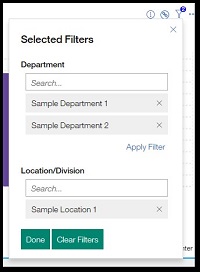
To edit filters within the visualization, open the Visualizations and Fields panes. Only filter fields currently added to the visualization can be edited through the Visualization Indicator.
Select the Filters Indicator icon.
Select the Edit icon.
Add a filter by entering the filter name into search field and selecting Enter.
Remove filter criteria by selecting the X icon.
Select Clear Filters to clear all filters from the visualization. Filters cannot be restored automatically. If cleared, filters need to be added again manually.
Select Apply Filter to apply the updates to the current visualization.
Select Done to save the filter changes to the visualization.

Export a Visualization
Visualizations can be exported to PDFs. Tables can be exported to a Microsoft Excel format.
For the visualization, select Actions → Export.
The file downloads for viewing or editing.
Delete a Visualization
The Delete option is available on the My Metrics Dashboard, Visualizations Library, and Manage Dashboard workspaces.
Admin Note: If a visualization is deleted from a Manage Dashboards workspace, the visualization is deleted from the current view only. This process does not delete the visualization for any users who are subscribed to the visualization.
Admin Note: If a visualization is deleted from the Visualization Library workspace, it is only deleted from that workspace. For any persona subscribed to this visualization, it is not deleted and becomes a stand-alone visualization. To remove the visualization from multiple personas, clear the Manage Subscriptions option for the specific personas before deleting the visualization. For more information about this process, see the Metrics Dashboard Example Visualizations.
For the visualization, select Actions → Delete.
The visualization is removed from the workspace.